mirror of
https://github.com/oven-sh/bun
synced 2026-02-10 19:08:50 +00:00
194 lines
6.0 KiB
Markdown
194 lines
6.0 KiB
Markdown
To precisely measure time, Bun offers two runtime APIs functions:
|
|
|
|
1. The web-standard [`performance.now()`](https://developer.mozilla.org/en-US/docs/Web/API/Performance/now) function
|
|
2. `Bun.nanoseconds()` which is similar to `performance.now()` except it returns the current time since the application started in nanoseconds. You can use `performance.timeOrigin` to convert this to a Unix timestamp.
|
|
|
|
## Benchmarking `Bun.serve`
|
|
|
|
You will need an HTTP client which is at least as fast as `Bun.serve()`.
|
|
|
|
That means popular Node.js-based benchmarking tools like **autocannon is not fast enough**.
|
|
|
|
Recommended HTTP clients:
|
|
|
|
- [`bombardier`](https://github.com/codesenberg/bombardier)
|
|
- [`oha`](https://github.com/hatoo/oha)
|
|
- [`http_load_test`](https://github.com/uNetworking/uSockets/blob/master/examples/http_load_test.c)
|
|
|
|
## Measuring memory usage
|
|
|
|
Bun has two heaps. One heap is for the JavaScript runtime and the other heap is for everything else.
|
|
|
|
### JavaScript heap stats
|
|
|
|
The `bun:jsc` module exposes a few functions for measuring memory usage:
|
|
|
|
```ts
|
|
import { heapStats } from "bun:jsc";
|
|
console.log(heapStats());
|
|
|
|
// will show something like this:
|
|
{
|
|
heapSize: 1657575,
|
|
heapCapacity: 2872775,
|
|
extraMemorySize: 598199,
|
|
objectCount: 13790,
|
|
protectedObjectCount: 62,
|
|
globalObjectCount: 1,
|
|
protectedGlobalObjectCount: 1,
|
|
// A count of every object type in the heap
|
|
objectTypeCounts: {
|
|
CallbackObject: 25,
|
|
FunctionExecutable: 2078,
|
|
AsyncGeneratorFunction: 2,
|
|
'RegExp String Iterator': 1,
|
|
FunctionCodeBlock: 188,
|
|
ModuleProgramExecutable: 13,
|
|
String: 1,
|
|
UnlinkedModuleProgramCodeBlock: 13,
|
|
JSON: 1,
|
|
AsyncGenerator: 1,
|
|
Symbol: 1,
|
|
GetterSetter: 68,
|
|
ImportMeta: 10,
|
|
DOMAttributeGetterSetter: 1,
|
|
UnlinkedFunctionCodeBlock: 174,
|
|
RegExp: 52,
|
|
ModuleLoader: 1,
|
|
Intl: 1,
|
|
WeakMap: 4,
|
|
Generator: 2,
|
|
PropertyTable: 95,
|
|
'Array Iterator': 1,
|
|
JSLexicalEnvironment: 75,
|
|
UnlinkedFunctionExecutable: 2067,
|
|
WeakSet: 1,
|
|
console: 1,
|
|
Map: 23,
|
|
SparseArrayValueMap: 14,
|
|
StructureChain: 19,
|
|
Set: 18,
|
|
'String Iterator': 1,
|
|
FunctionRareData: 3,
|
|
JSGlobalLexicalEnvironment: 1,
|
|
Object: 481,
|
|
BigInt: 2,
|
|
StructureRareData: 55,
|
|
Array: 179,
|
|
AbortController: 2,
|
|
ModuleNamespaceObject: 11,
|
|
ShadowRealm: 1,
|
|
'Immutable Butterfly': 103,
|
|
Primordials: 1,
|
|
'Set Iterator': 1,
|
|
JSProxy: 1,
|
|
AsyncFromSyncIterator: 1,
|
|
ModuleRecord: 13,
|
|
FinalizationRegistry: 1,
|
|
AsyncIterator: 1,
|
|
InternalPromise: 22,
|
|
Iterator: 1,
|
|
CustomGetterSetter: 65,
|
|
Promise: 19,
|
|
WeakRef: 1,
|
|
InternalPromisePrototype: 1,
|
|
Function: 2381,
|
|
AsyncFunction: 2,
|
|
GlobalObject: 1,
|
|
ArrayBuffer: 2,
|
|
Boolean: 1,
|
|
Math: 1,
|
|
CallbackConstructor: 1,
|
|
Error: 2,
|
|
JSModuleEnvironment: 13,
|
|
WebAssembly: 1,
|
|
HashMapBucket: 300,
|
|
Callee: 3,
|
|
symbol: 37,
|
|
string: 2484,
|
|
Performance: 1,
|
|
ModuleProgramCodeBlock: 12,
|
|
JSSourceCode: 13,
|
|
JSPropertyNameEnumerator: 3,
|
|
NativeExecutable: 290,
|
|
Number: 1,
|
|
Structure: 1550,
|
|
SymbolTable: 108,
|
|
GeneratorFunction: 2,
|
|
'Map Iterator': 1
|
|
},
|
|
protectedObjectTypeCounts: {
|
|
CallbackConstructor: 1,
|
|
BigInt: 1,
|
|
RegExp: 2,
|
|
GlobalObject: 1,
|
|
UnlinkedModuleProgramCodeBlock: 13,
|
|
HashMapBucket: 2,
|
|
Structure: 41,
|
|
JSPropertyNameEnumerator: 1
|
|
}
|
|
}
|
|
```
|
|
|
|
JavaScript is a garbage-collected language, not reference counted. It's normal and correct for objects to not be freed immediately in all cases, though it's not normal for objects to never be freed.
|
|
|
|
You can force garbage collection to run manually by calling:
|
|
|
|
```js
|
|
const synchronously = true;
|
|
Bun.gc(synchronously);
|
|
```
|
|
|
|
### JavaScript heap snapshot
|
|
|
|
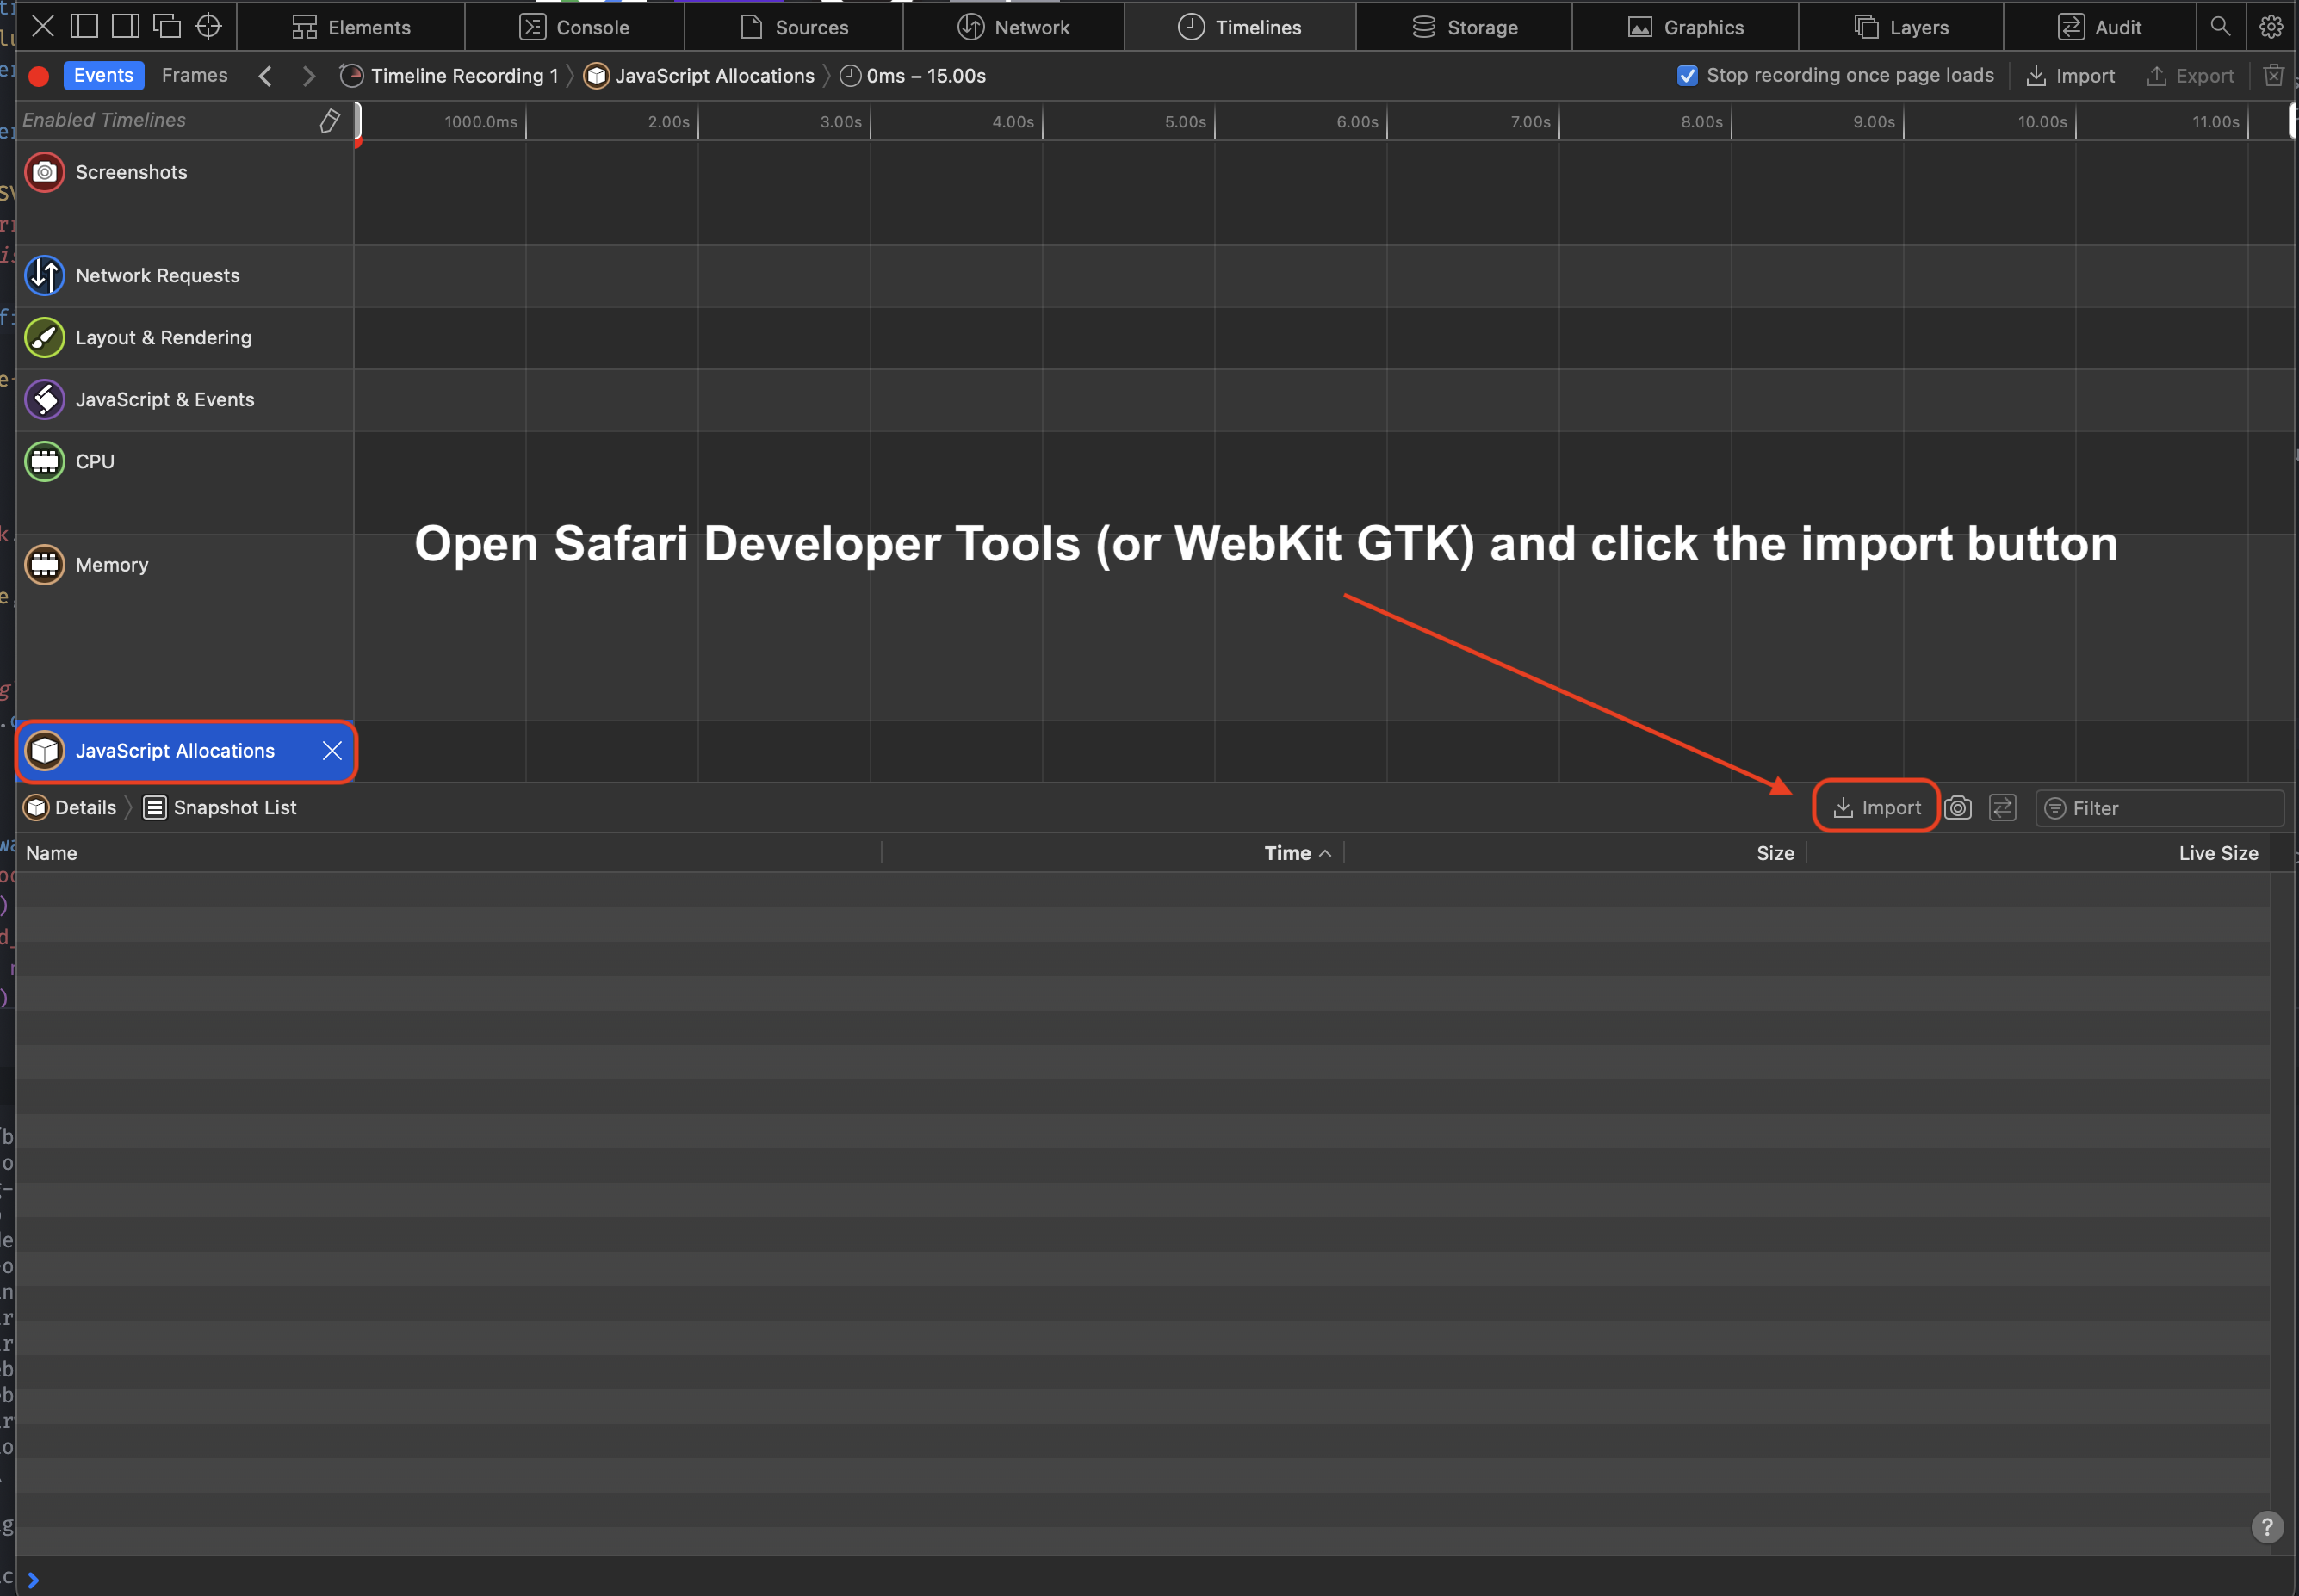
Heap snapshots let you inspect what objects are not being freed. You can use the `bun:jsc` module to take a heap snapshot and then view it with Safari or WebKit GTK developer tools.
|
|
|
|
{% image alt="image" src="https://user-images.githubusercontent.com/709451/204429337-b0d8935f-3509-4071-b991-217794d1fb27.png" /%}
|
|
|
|
To generate a heap snapshot:
|
|
|
|
```ts
|
|
import { generateHeapSnapshot } from "bun";
|
|
|
|
const snapshot = generateHeapSnapshot();
|
|
await Bun.write("heap.json", JSON.stringify(snapshot, null, 2));
|
|
```
|
|
|
|
To view the snapshot, open the `heap.json` file in Safari's Developer Tools (or WebKit GTK)
|
|
|
|
1. Open the Developer Tools
|
|
2. Click "Timeline"
|
|
3. Click "JavaScript Allocations" in the menu on the left. It might not be visible until you click the pencil icon to show all the timelines
|
|
4. Click "Import" and select your heap snapshot JSON
|
|
|
|
|
|
|
|
### Native heap stats
|
|
|
|
Bun uses mimalloc for the other heap. To report a summary of non-JavaScript memory usage, set the `MIMALLOC_SHOW_STATS=1` environment variable. and stats will print on exit.
|
|
|
|
```js
|
|
MIMALLOC_SHOW_STATS=1 bun script.js
|
|
|
|
# will show something like this:
|
|
heap stats: peak total freed current unit count
|
|
reserved: 64.0 MiB 64.0 MiB 0 64.0 MiB not all freed!
|
|
committed: 64.0 MiB 64.0 MiB 0 64.0 MiB not all freed!
|
|
reset: 0 0 0 0 ok
|
|
touched: 128.5 KiB 128.5 KiB 5.4 MiB -5.3 MiB ok
|
|
segments: 1 1 0 1 not all freed!
|
|
-abandoned: 0 0 0 0 ok
|
|
-cached: 0 0 0 0 ok
|
|
pages: 0 0 53 -53 ok
|
|
-abandoned: 0 0 0 0 ok
|
|
-extended: 0
|
|
-noretire: 0
|
|
mmaps: 0
|
|
commits: 0
|
|
threads: 0 0 0 0 ok
|
|
searches: 0.0 avg
|
|
numa nodes: 1
|
|
elapsed: 0.068 s
|
|
process: user: 0.061 s, system: 0.014 s, faults: 0, rss: 57.4 MiB, commit: 64.0 MiB
|
|
```
|